Guide · Pricing research
Van Westendorp price sensitivity: a quick guide
7 minute read
Van Westendorp is a price sensitivity survey method that asks each person for four numbers: when an offer feels too cheap, cheap, expensive and too expensive. The curves formed from those answers suggest a price range people find acceptable. They do not show what people will buy.

Key points
- Ask four open numeric questions about one clearly described product (method documentation).
- The outer curve crossings suggest a perceived acceptable range, not a sales forecast (method documentation).
- Choose likely buyers and enough responses for a stable pattern; there is no universal sample size.
- Check the range against costs and observed buying behaviour.
What is the Van Westendorp price sensitivity meter?
Peter van Westendorp presented the Price Sensitivity Meter in 1976, as documented in the method reference. It studies how people perceive a price. A respondent names four thresholds for one product; across a group, those answers form four curves. Their crossing points describe a range and two central prices. For a founder with no sales data, it can show whether a proposed price sits near the group’s quality concerns or at the point where the item feels too dear. That is a question about perception, and the distinction should stay visible throughout the study.
It is easy to read too much into a label on the chart. The “optimal price point” balances two kinds of price resistance in stated answers. It is not the price that maximises revenue or profit. If the product costs too much to make at that point, or buyers behave differently when paying, the chart cannot make the business work.
The four price sensitivity survey questions
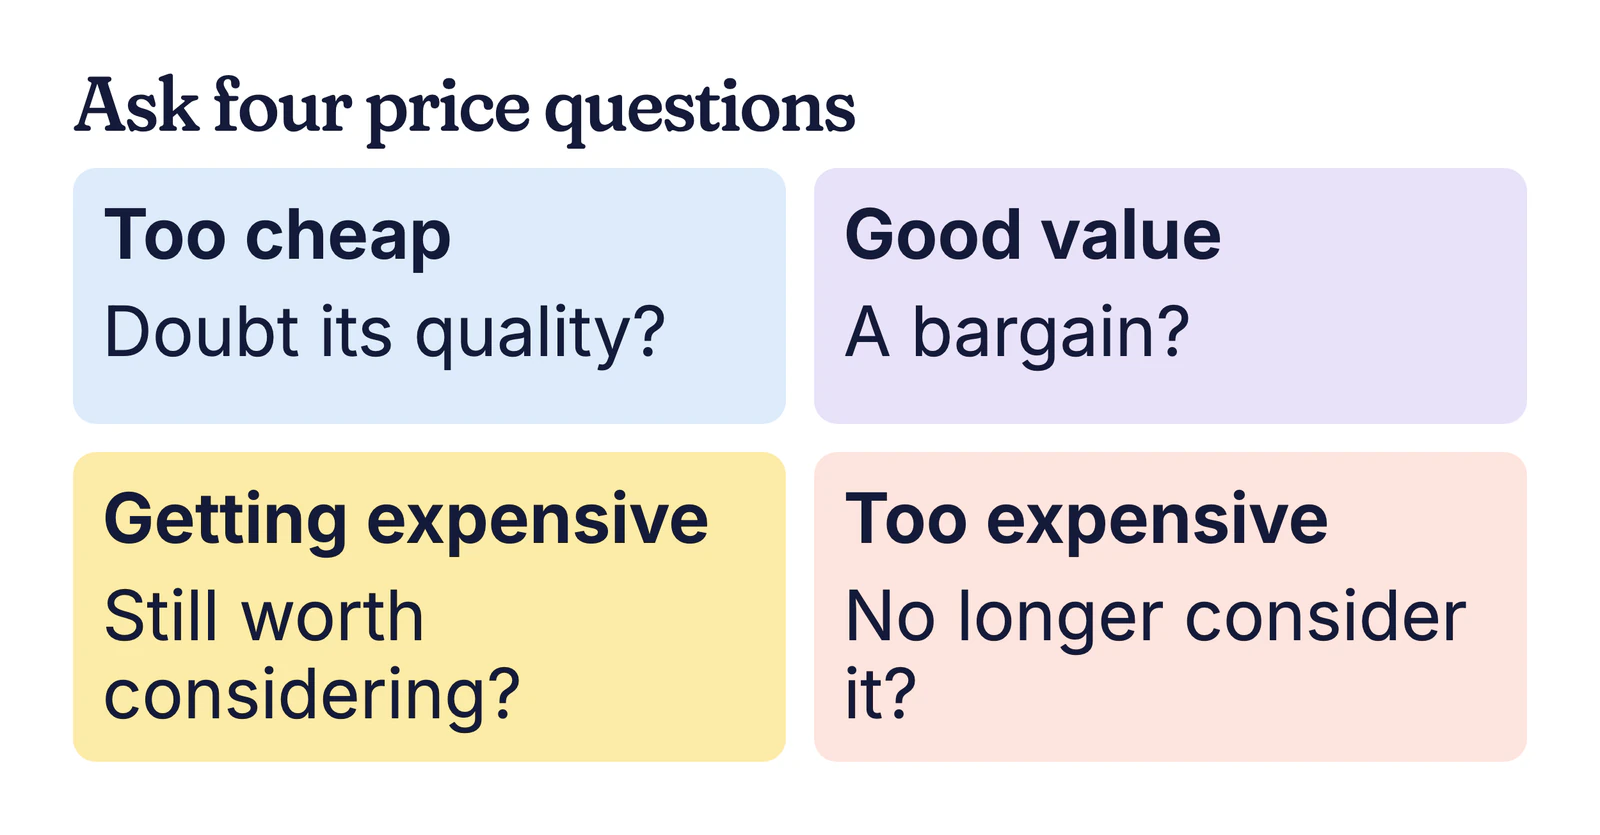
Show every person the same product, size, features and buying context. Then ask for a price in pounds at which it would seem (four thresholds in the method documentation):
- So cheap that you would question its quality.
- Cheap, or a bargain.
- Expensive, though still worth considering.
- Too expensive to consider.
Ask for four numbers, not a choice among “low”, “fair” and “high”. Those three bands can give a quick reaction but cannot produce a Van Westendorp curve. The method documentation expects the four thresholds in order. Check that each person’s numbers rise in the order above. If “too expensive” is below “cheap”, clarify the response or treat it as inconsistent.
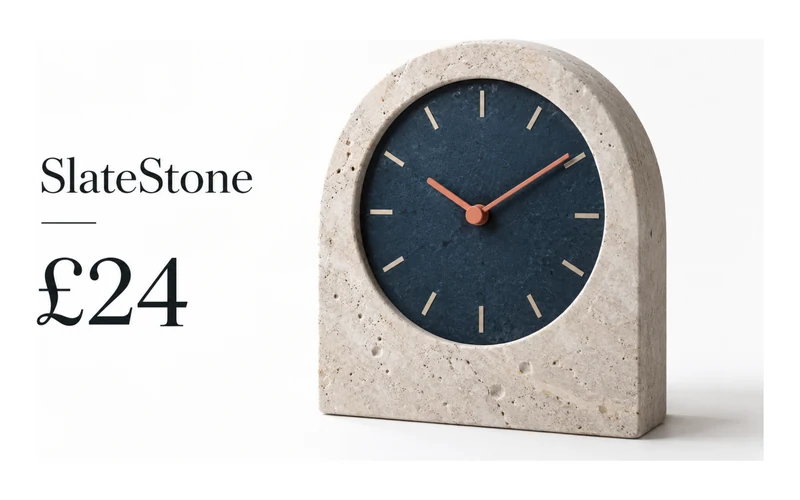
Fictional mini-example: five people price a desk clock. Their four thresholds, in pounds and in question order, are 8/12/20/30, 10/15/24/35, 9/14/22/32, 12/18/28/40 and 7/11/19/29. That is five respondents and 20 recorded thresholds. It shows how the answers are collected. Five people are not enough to choose the clock’s retail price or draw a dependable curve.
How to read the Van Westendorp chart
For each possible price, count the share who call it too cheap, cheap, expensive or too expensive. The method documentation describes the cumulative curve directions, which let the cheap and too-cheap responses be compared with the expensive responses as price rises. Where the lines cross, the method gives four named points.
The point of marginal cheapness is the lower bound of the original acceptable range. Below it, too-cheap concern outweighs the opposing view. The point of marginal expensiveness is the upper bound, beyond which too-expensive concern dominates. The indifference price point is where cheap and expensive perceptions meet. The optimal price point is where too-cheap and too-expensive perceptions meet. These definitions are given in the pricesensitivitymeter method documentation, which cites van Westendorp’s original paper.
Some software uses a narrower convention for the outer range, with different crossing lines. Record which convention, price scale and weighting you used before comparing two studies. A neat graph can still be misleading if the product changed between questions or the respondents were not likely buyers.
How many people for a price sensitivity test?
There is no single number that makes every price sensitivity test reliable. You need people who understand or might buy the category, and enough of them that a few extreme answers do not move the crossings sharply. If you plan to compare segments, each segment needs its own useful set of responses. The five-person clock illustration is only a way to explain the format.
Pilot the wording before commissioning a bigger survey. Some people hear “too cheap” as “a good bargain”, when the question means “so low that quality becomes doubtful”. Show a clear photograph or product description and specify what is included. Poorly understood questions do not improve just because more people answer them.

Willingness to pay survey or price sensitivity test?
Willingness to pay is a broad phrase. Van Westendorp asks people to supply their own four thresholds. A Gabor-Granger study shows particular prices and asks about purchase intent at each one. The latter can compare prices you already have in mind; the former can help explore a range when you do not. Both still rely on what people say, rather than a transaction.
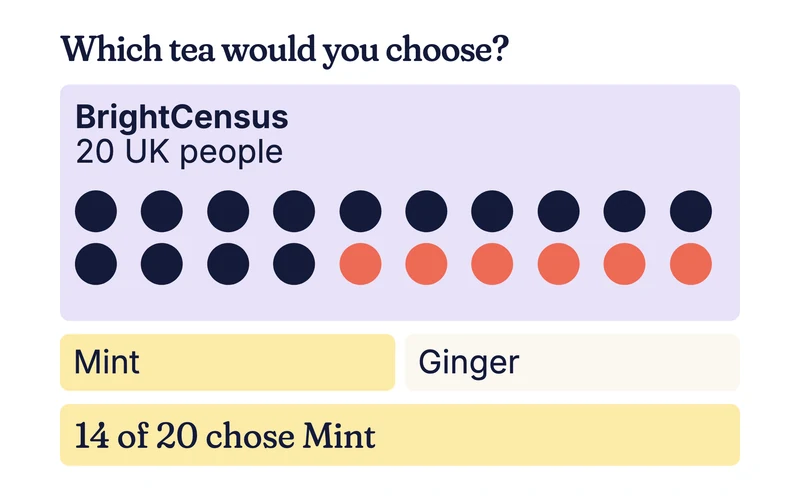
Choose the method for the decision. If you only need to know whether £24 feels fair for a new clock, a short pick-one question may be enough to find a presentation problem. If you need a willingness to pay survey to inform a pricing strategy, recruit suitable buyers, use a consistent offer and analyse the full set. If the product already sells, your own transaction data may answer the question more directly. The asker hub, founder page and idea-validation tools comparison cover nearby early decisions.
Where the method can mislead
A Van Westendorp range does not include your costs, competing products, discounts or what someone does when the money is theirs. A person who has never bought a desk clock may name a price for an imaginary item. Their answer is less useful than one from a likely buyer who can see the clock’s size and material. And a product photograph that hides the size or materials can move answers for the wrong reason.
Keep the question wording, product description, respondent criteria and curve convention with the chart. If a later team changes any of them, the two ranges are not directly comparable. Use the result to narrow the prices worth testing, then check your costs and observe what buyers actually choose before setting a selling price.
Where PennyForYours fits
Our numeric price-check format is Later. PennyForYours cannot run a Van Westendorp study today. A current quick take can ask “Is £24 fair for this clock: low, fair or high?” to 5 to 50 UK adults. Their one-line reasons give a directional reaction, not four price curves. See how the current price test works.
Sources
- pricesensitivitymeter R package documentation, four questions and original curve definitions, checked 7 October 2026. It cites P. van Westendorp’s 1976 ESOMAR paper.
- SurveyMonkey: Gabor-Granger method guide, first-party survey-method explanation of stated intent at set prices, checked 7 October 2026.